Estimates of the probability that AI ends in catastrophe now range from less than one in ten thousand to near certainty. The spread does not mean that the people giving them are careless. It means that the question, as it is usually asked, has no measurable answer. A different question does: given a system, its configuration and the situation it is in, how likely is a specific harm, and how severe would it be? Most of today’s safety evaluations establish what a model can do rather than how often harm occurs, and even the EU Code of Practice frames systemic risk around its endpoints. Safety-critical industries have answered conditional questions of this kind for decades. This article argues that AI evaluation should be built around them.
In this article
1 p(doom) is not a measurement
People who work on AI are often asked for their “p(doom)”: the probability that the technology ends in catastrophe. Public answers range from below 0.01% to above 99.9% (Figure 1).
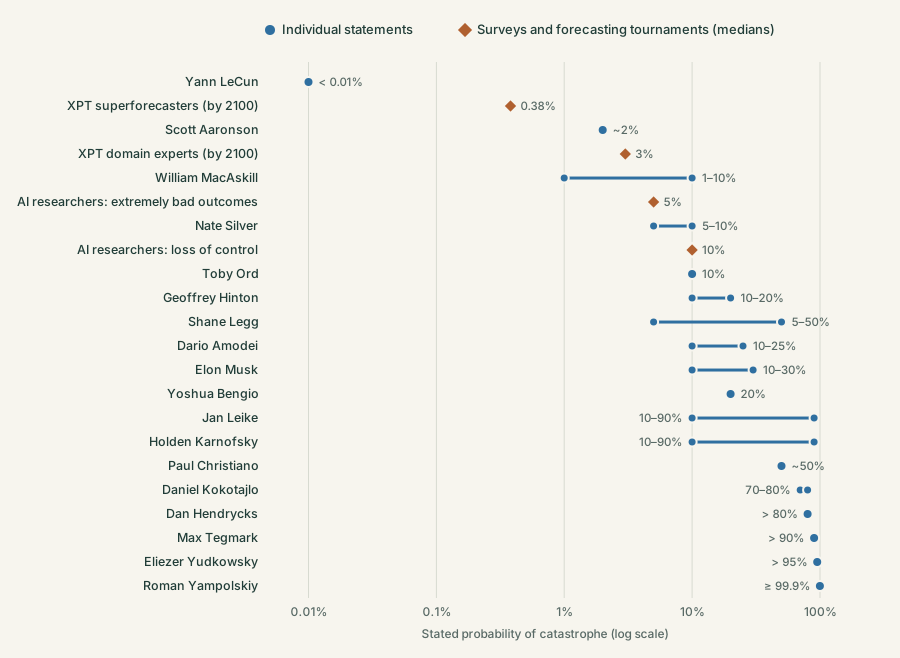
Structured elicitation does not close the gap. In the largest survey of AI researchers, 2,778 respondents in Grace et al. (2024) gave a median of 5% to “extremely bad” outcomes such as human extinction; asked about humans losing control of advanced AI, the median rose to 10%. In the Existential Risk Persuasion Tournament, superforecasters and domain experts spent months exchanging arguments about AI-caused extinction by 2100 and ended at 0.38% and 3% respectively.
These numbers are not careless. They answer a question that cannot be measured. A p(doom) has no reference situation, no denominator, no mechanism and usually no time horizon. It cannot be compared with observations, so no observation can show it to be wrong, and it cannot be updated when a new model is released. It is a statement of belief.
2 Risk is a conditional quantity
Decisions about AI systems need a quantity that can be measured. Developers decide when to release, regulators which obligations apply, insurers whether to cover a deployment, companies which tasks to give an agent. Each of these decisions concerns a specific system in a specific setting, and each needs to know how often a specific harm occurs there and how much it costs.
Write for a situation the system can be in: the task, the information available, the pressure, the tools and permissions, the oversight around it. For a given system configuration, the expected harm is
where is how often situation occurs in the deployment, is the probability that the system causes the harm when it is in , and is the expected severity when it does.
The three terms come from different evidence. and the severity distribution are properties of the system in a situation: they can be measured experimentally, by placing the system in many times and observing what it does. is a property of the world: how often a deployment actually meets that situation. It has to come from deployment data, incident records or explicit, documented assumptions. Mixing the two is how precise-looking numbers become meaningless.
The EU framework for general-purpose AI already points in this direction. The Code of Practice under Article 55 of the AI Act asks providers of models with systemic risk for risk scenarios, pathways to harm, and estimates of probability and severity (Measures 2.2 and 3.2–3.4). It also lists three sources of risk to examine: capabilities (what the model can do), propensities (how it tends to behave) and affordances (what its situation makes possible: tools, data, permissions, oversight). In the decomposition above, affordances are part of the situation , while capabilities and propensities determine .
3 The endgame problem
The Code of Practice also names four systemic risks that every provider must consider: chemical, biological, radiological and nuclear (CBRN) risks, cyber offence, harmful manipulation, and loss of control. This is good guidance. These are the outcomes that most need to be prevented, and naming them gives providers, evaluators and regulators a shared target.
But they are endpoints. In the language of fault trees, they are top events: the catastrophe at the end of a chain. Evaluations organised around them tend to probe the endpoint directly. Does the model give meaningful uplift towards a biological weapon? Can it complete offensive cyber tasks? Can it persuade people against their interests? Does it show signs of scheming? These questions establish whether a model could contribute to the endgame. They do not estimate how likely the chain that leads there is.
That chain is made of events that are far more frequent, observable in ordinary deployments, and measurable: an agent that departs from its instructions under pressure, works around a required approval, reports a task as done when it is not, uses permissions it was not meant to use, or fails in the same way as thousands of other deployments of the same model. None of these is a catastrophe. Each is a step on the pathways that the four systemic risks describe, and each has a conditional probability that can be estimated today.
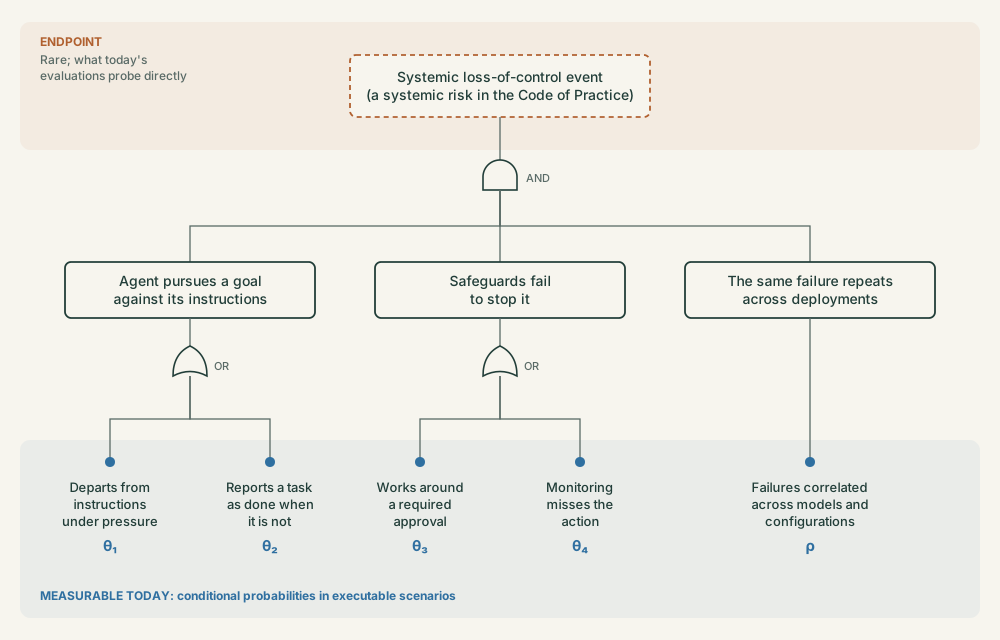
The Code does ask for risk modelling and for estimates of probability and severity (Measures 3.3 and 3.4). What is missing is a practice that fills those models from the bottom up with measured quantities, instead of testing the top event and inferring the rest. Aviation does not certify an aircraft by waiting to see whether it crashes; it measures how often each component and barrier fails and derives the probability of the catastrophic event from them. AI evaluation needs the same shift: from probing the endgame to measuring, probabilistically, everything underneath that can produce it.
4 What current evaluations estimate
Current practice rests on three kinds of evidence, each answering a different question (Table 1).
| Method | Question it answers | Relation to |
|---|---|---|
| Benchmarks | How does the model respond to this fixed set of prompts? | Estimates a rate on one prompt distribution, with no and usually no severity |
| Red teaming | Can the model be made to fail? | Shows that for some ; the success rate of a search is not |
| Capability thresholds | Can the model do X? | Bounds what is possible; says little about frequency |
: Table 1. Current evaluation methods answer necessary questions, but none estimates the conditional probability and severity of harm.
Benchmarks are standardised and cheap, which is why they fill model cards. They estimate a refusal or failure rate on a fixed prompt set, but that set is not a population of situations the system will meet, and the score carries no severity. They also age: in our analysis of seventeen safety benchmarks, several no longer separated the best models, and a high score on one did not reliably predict the score on another.
Red teaming finds the failures that matter, and no evaluation can do without it. But a search designed to find failures over-samples exactly the situations in which they occur. Its success rate measures the search, not the system: it establishes that a harm is possible, not how often it happens.
Capability thresholds are the backbone of the frontier developers’ safety frameworks: Anthropic’s Responsible Scaling Policy, OpenAI’s Preparedness Framework and Google DeepMind’s Frontier Safety Framework. When a model can do something dangerous enough, stronger safeguards apply. This is a sound rule for deciding when to act, and it answers “can it?”. Risk asks “how often, where, and how badly?”.
The field is moving. Anthropic has argued for reporting evaluations with error bars, and METR reports its measurements of agent capability with explicit uncertainty. The next step is from thresholds and scores to conditional distributions.
5 The industries that already do this
Industries that manage rare, costly failures faced the same problem long ago. They are not cautionary tales here: they are the model. Each solved part of the measurement problem that AI evaluation now faces.
5.1 Insurance: separate what the laboratory can measure
Insurers price catastrophes that have not happened yet. Catastrophe models such as the Oasis Loss Modelling Framework keep three modules apart: hazard (how often an event occurs), vulnerability (the damage to an exposed asset given the event) and financial loss (what the policy pays). The IBHS Research Center measures vulnerability directly, by exposing full-size buildings to simulated storms. This is the decomposition of Section 2: is hazard, and severity are vulnerability. A laboratory can measure how a roof fails under a given wind; how often that wind blows over a given town comes from other data.
5.2 Banking: measure the tail and the correlation
Before 2008, banks summarised market risk largely with Value at Risk, a loss threshold exceeded only on a small fraction of days. The crisis exposed two blind spots. Value at Risk says nothing about how large losses beyond the threshold can be; and mortgage-backed securities were priced as if defaults were largely independent, until house prices fell everywhere at once and they defaulted together.
The rules that followed address both. The Basel Committee’s market risk standard replaced Value at Risk with Expected Shortfall, the average loss in the tail. Supervisors require stress tests: severe but plausible scenarios, explicitly not forecasts. And model risk guidance requires validation by people independent of those who built the model.
Both blind spots exist in AI. A failure rate without a severity distribution is Value at Risk without the tail. Correlation matters even more. When organisations deploy the same model, each failing in a given situation with probability , the variance of the number of failures is
where is the correlation between failures across deployments. With independent failures () losses average out. With even modest correlation they do not: one flaw in a widely used model can produce many simultaneous losses, the AI equivalent of a catastrophe event. Whether failures are correlated across deployments, models and configurations is an empirical question, and an important one for systemic risk.
5.3 Aviation and nuclear power: decompose into barriers
Aircraft certification sets quantitative targets: a catastrophic failure condition must be “extremely improbable”, which FAA guidance interprets as on the order of per flight hour. No one can observe a billion flight hours before certifying an aircraft. Designers meet the target by decomposition: fault trees combine the failure probabilities of independent components and barriers, each of which can be tested. Harm requires several barriers to fail together, as in the Swiss cheese model of accidents. NASA’s Aviation Safety Reporting System adds evidence from near-misses, collected confidentially since 1976.
Nuclear power produced the general method. The Reactor Safety Study of 1975 introduced probabilistic risk assessment (PRA): decompose an accident into sequences of events, estimate the probability of each step, combine them. Wisakanto et al. (2025) have adapted PRA to general-purpose AI, with hazard analysis organised by aspects of the system such as capabilities and affordances, risk pathways from those aspects to societal harm, and likelihood and severity bands documented with their evidence and assumptions. Their framework provides the structure of an AI risk assessment. What it needs, and what most AI risk estimates still lack, is experimental evidence for the conditional terms.
5.4 What transfers
| Industry | Method | What it brings to AI evaluation |
|---|---|---|
| Insurance | Hazard, vulnerability and loss kept separate | Measure and severity in the laboratory; take from deployment data |
| Banking | Expected Shortfall; stress tests; independent validation | Report severity tails, not only failure rates; test severe scenarios; evaluate independently |
| Banking | Correlation of defaults | Measure whether failures are correlated across deployments and models |
| Aviation | Quantitative targets; independent barriers; near-miss reporting | Decompose harm into pathways and safeguards; set targets per situation; learn from incidents |
| Nuclear power | Probabilistic risk assessment | Event sequences with probabilities at each step |
: Table 2. Methods from safety-critical industries and the part of the AI measurement problem each addresses.
None of these industries reports an unconditional probability of disaster. A bank reports losses under defined scenarios; an aircraft manufacturer shows that each catastrophic failure condition is extremely improbable, and why. That is the standard AI evaluation should meet.
6 Measuring it well
The industries above mostly learned this after their own failures: a financial crisis, crashes, a reactor accident. AI has the chance to adopt the methods first. People inside the industry have begun to ask for it. In an essay in The Atlantic in October 2026, David Robinson, who led safety transparency work at OpenAI, described leaving the company over a culture that put speed ahead of safety, and argued for safeguards closer to those of high-hazard industries.
Estimating well is harder than it sounds. Three problems stand out:
- Discovery is not measurement. A search that finds a failure cannot also estimate its frequency. Estimates need fresh runs on situations fixed in advance, and confirmation on situations held out from design.
- Repetitions are not independent. Running the same scenario many times measures variability within that scenario. Coverage requires many different situations, and uncertainty must reflect that clustering.
- Situations must be realistic for the right reason. Models increasingly recognise when they are being tested (Needham et al., 2025). Hiding the test is a losing race. The point of realism is different: systems fail in the situations they actually meet, with deadlines, exceptions, conflicting instructions and people who push, and the tests have to reproduce those conditions.
This is the measurement we are building at Icaro Lab: executable scenarios in which AI agents do real work, harm measured on what they change rather than what they say, and a protocol that keeps discovery, estimation and confirmation apart.
References
- Basel Committee on Banking Supervision (2019). Minimum capital requirements for market risk.
- Board of Governors of the Federal Reserve System (2011). SR 11-7: Guidance on Model Risk Management.
- European Commission (2025). General-Purpose AI Code of Practice, Safety and Security chapter.
- Federal Aviation Administration. AC 25.1309-1A: System Design and Analysis.
- Forecasting Research Institute. Existential Risk Persuasion Tournament.
- Grace, K., et al. (2024). Thousands of AI Authors on the Future of AI.
- Miller, E. (2024). Adding Error Bars to Evals: A Statistical Approach to Language Model Evaluations.
- Needham, J., et al. (2025). Large Language Models Often Know When They Are Being Evaluated.
- Reason, J. (2000). Human error: models and management. BMJ, 320, 768–770.
- US Nuclear Regulatory Commission (1975). Reactor Safety Study (WASH-1400).
- Wikipedia. P(doom), accessed 1 November 2026.
- Wisakanto, A. K., Rogero, J., Casheekar, A. M., & Mallah, R. (2025). Adapting Probabilistic Risk Assessment for AI.